There are several profilers for heap memory usage. The one I describe here is using the heap profiler from google’s performance tools. A very similar approach should be possible with jemalloc, but I could never get it to actually work, even when building it from source.
The performance tools can be easily installed via
sudo apt install google-perftoolsThe quickest way to use the heap profiler is to to preload the library and configure it via environment variables (the other option is to link it when building the software).
First, set the variable LD_PRELOAD to the installed libtcmalloc_and_profiler.so. You can find its location with
dpkg -L libgoogle-perftools4|grep libtcmalloc_and_profiler.soIf you get more than one result, it’s probably symbolic links to the same lib, so it doesn’t matter which one you choose. On amd64 this results in
/usr/lib/x86_64-linux-gnu/libtcmalloc_and_profiler.so.4.3.0so you should export the variable as follows:
export LD_PRELOAD=/usr/lib/x86_64-linux-gnu/libtcmalloc_and_profiler.so.4.3.0When starting any executable, this tells the dynamic linker to first load and link the library libtcmalloc_and_profiler.so.4.3.0 to the executable. Among others, libtcmalloc_and_profiler provides implementations of malloc and free. So with LD_PRELOAD set, all calls to malloc and free will be linked to those implementations, instead of the “original” ones in libc.
libtcmalloc can then profile all calls to malloc and free. To make it actually do so, you need to set an output file prefix in the environment variable HEAPPROFILE, e.g. “/tmp/tc-malloc”. In that case the memory profile is then dumped to /tmp/tc-malloc.0001.heap (increasing the number each time) after each 1GB of allocation and each time the overall memory has increased another 100MB. Further the profile is written upon exit. This behavior can be tuned by setting the environment variables HEAP_PROFILE_ALLOCATION_INTERVAL and HEAP_PROFILE_INUSE_INTERVAL in bytes.
You can also set a time interval at which to write out the profiling information, by setting HEAP_PROFILE_TIME_INTERVAL in seconds.
So assuming LD_PRELOAD is exported as shown above, start your executable (here aptitude with its parameters search somepackage) like this:
HEAPPROFILE=/tmp/tc-malloc HEAP_PROFILE_TIME_INTERVAL=5 aptitude search somepackageYou should see something like
(…) Dumping heap profile to tc-malloc.0001.heap (Exiting, 200 kB in use)
To view the profile use google-pprof. It provides multiple options to view the profile: interactive console, plain text output, and graphing in several formats.
The most simple for a quick glance:
$ google-pprof --text $(which aptitude) tc-malloc.0001.heap |head
Using local file /usr/bin/aptitude.
Using local file tc-malloc.0001.heap.
Total: 0.2 MB
     0.1  32.5%  32.5%      0.1  34.8% std::vector::emplace_back
     0.0  18.3%  50.8%      0.0  22.4% std::_Hashtable::_M_emplace
     0.0  15.2%  66.0%      0.0  15.8% Configuration::Lookup@af580
     0.0  10.7%  76.6%      0.0  10.7% std::__cxx11::basic_string::_M_assign
     0.0   2.9%  79.5%      0.0   2.9% _dl_new_object
     0.0   2.7%  82.2%      0.0   2.7% std::_Hashtable::_M_rehash
     0.0   2.5%  84.6%      0.0   2.5% __duplocale
     0.0   2.3%  86.9%      0.0   6.7% boost::throw_exception
     0.0   1.8%  88.7%      0.0   1.8% _nl_intern_locale_data
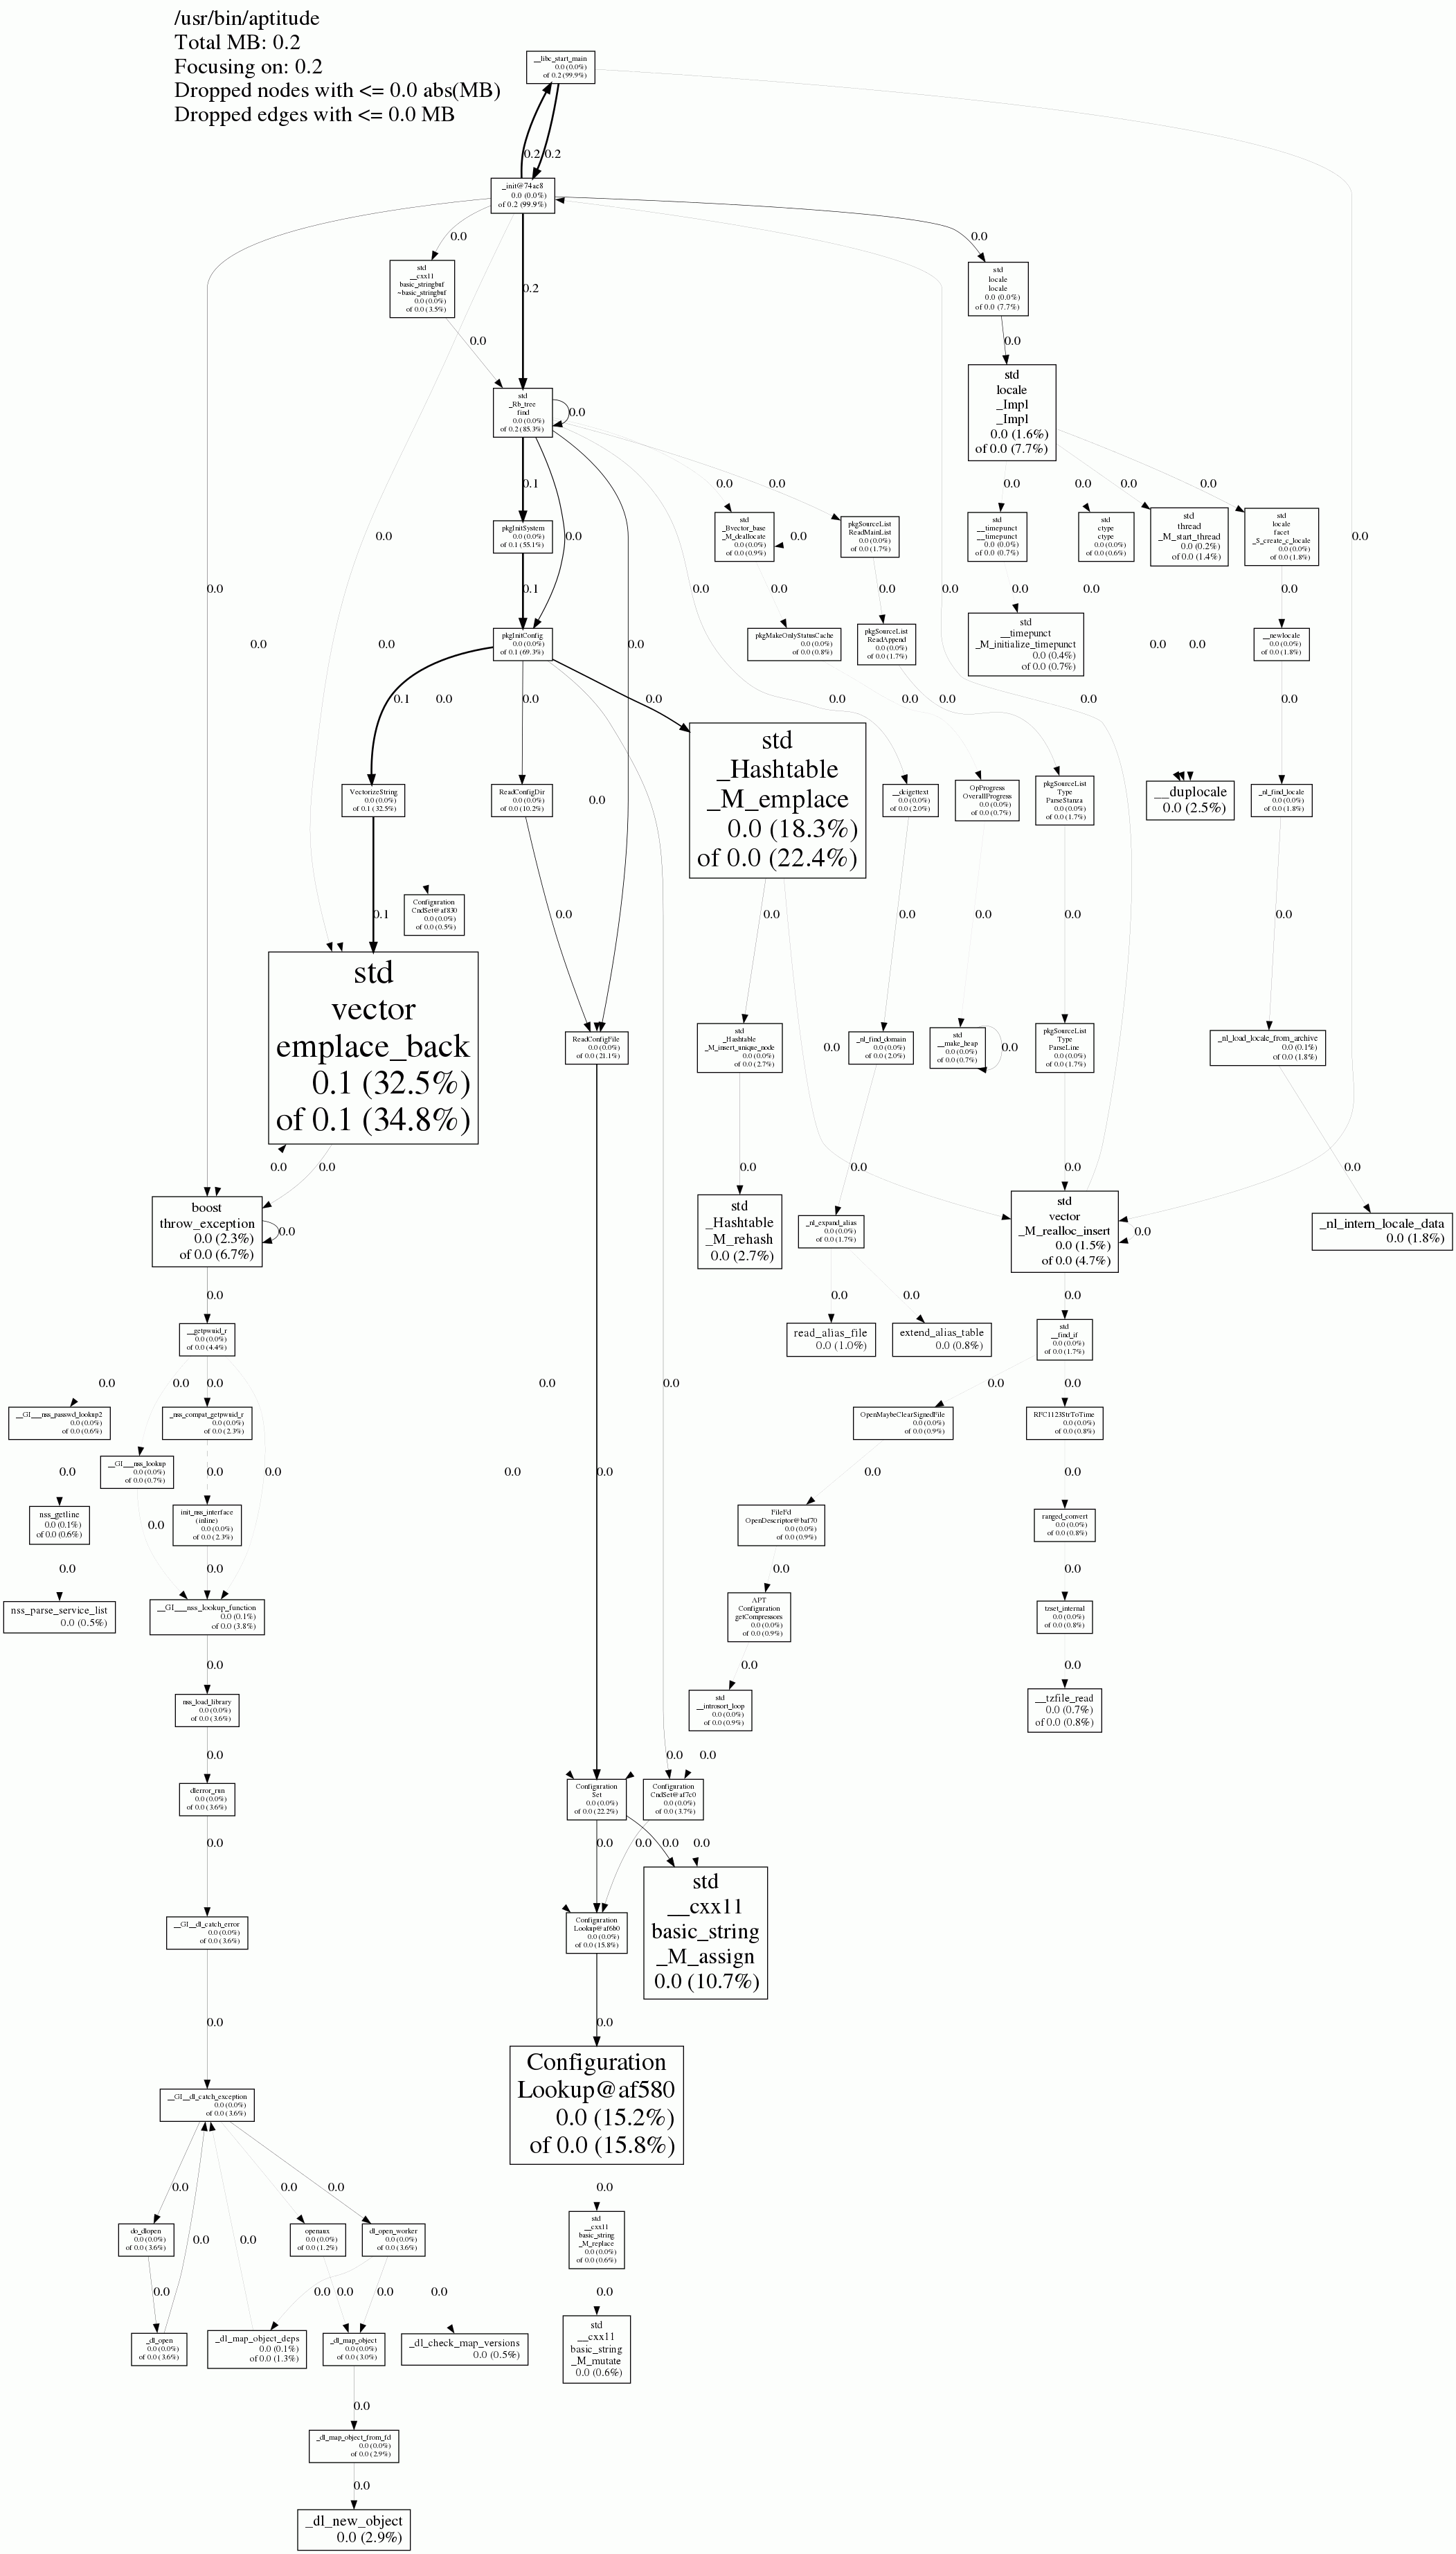
Graphical inspection in a gif file (pdf is even nicer):
google-pprof --gif $(which aptitude) tc-malloc.0001.heap > aptitude-malloc.gif
This should enable you to find the memory hogs in your programs!